Analytics
Read your sales numbers
See your sales, orders, best products and customers for any period, and compare with the period before.
Open this in your dashboard6 steps · Video
Analytics shows how the shop is doing, in dollars and in your store's time, from the online store, the sales you log in your shop and manual orders together.
Watch the video
What the video says
- In this video, you read your sales for a period, compare them with the period before, and open the details.
- Open Analytics from the menu.
- Your online orders, shop sales and manual orders are counted together, in dollars.
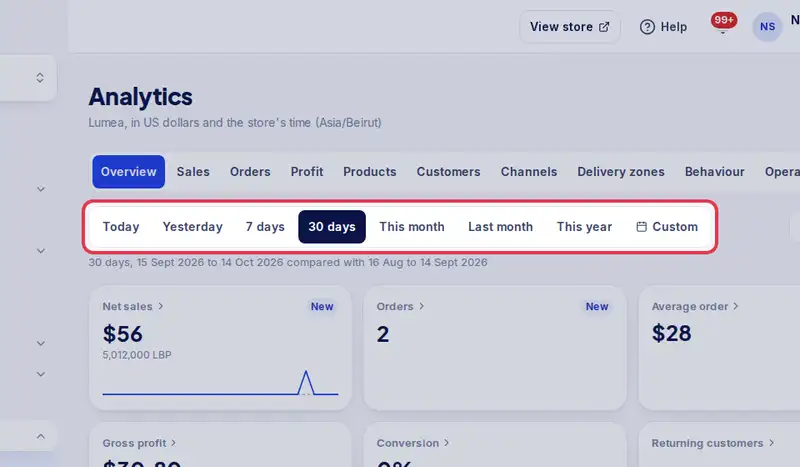
- Pick the period at the top, for example the last 7 days.
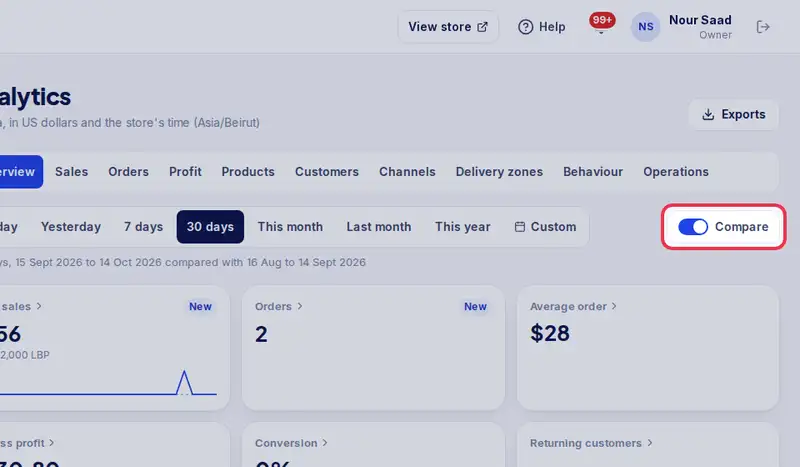
- With Compare on, each number shows the change from the period before.
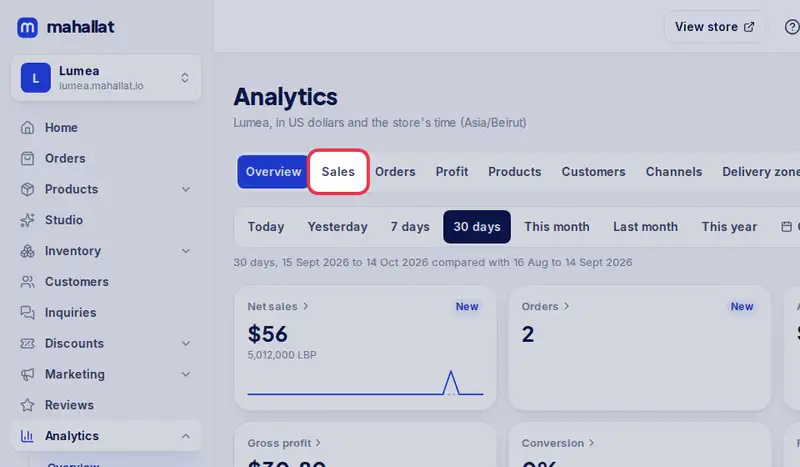
- Switch between the sections, like Sales, Products or Customers.
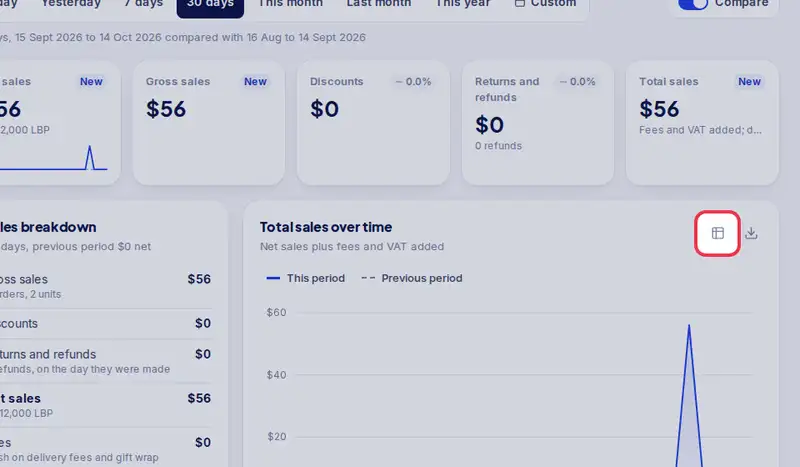
- On a chart, tap the table button to read the exact numbers.
- Test orders are never counted, and refunds count on the day you make them.
Step by step
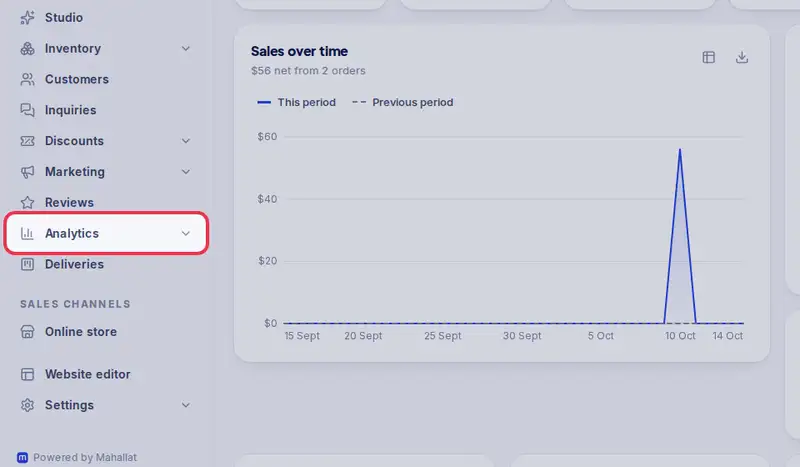
- Step 1: Open Analytics in the menu.
- Step 2: Pick the period: Today, the last 7 or 30 days, this month, or your own dates.
- Step 3: Turn on Compare to see each number next to the period before.
- Step 4: Switch between Overview, Sales, Products, Customers, Behaviour and Operations.
- Step 5: On any chart, tap the table button to read the exact numbers.
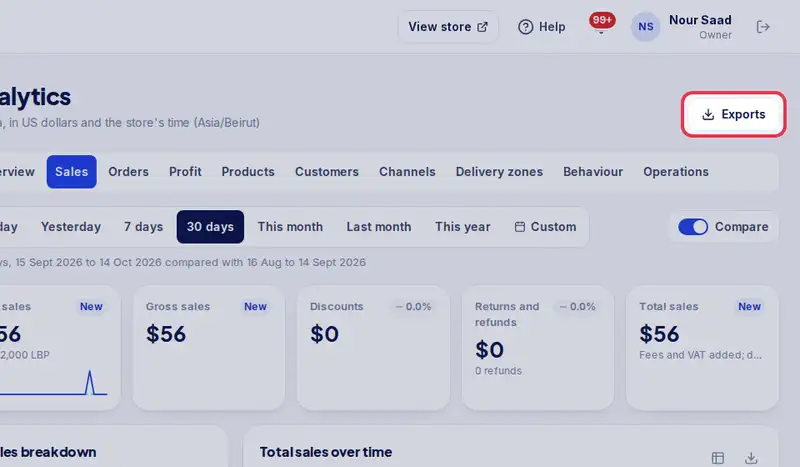
- Step 6: Need the numbers in Excel? Tap Exports.